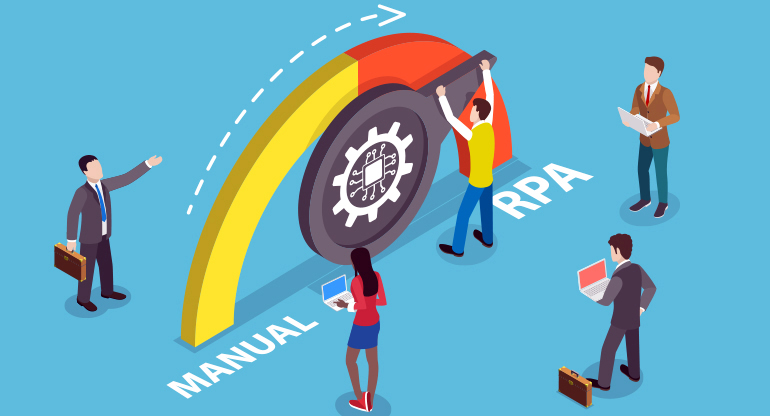

Robotic Process Automation Can Lead to Data Analytics of PowerPoint Files
We used RPA to help us analyze a bunch of the ubiquitous documents. This is what happened

Blog Posts
Microsoft PowerPoint is used by all kinds of organizations to share information about plans, projects, strategies, and status updates, among many kinds of content. Organizations often create standard PowerPoint templates for their people to use in creating the content. PowerPoint is convenient in that someone can input data and it's immediately available for presentation purposes.
As a result, vast amounts of corporate knowledge lie in PowerPoint documents. While in some cases the documents can be searched easily, comparing data across documents in meaningful ways is a very tedious and time-intensive task. If a company has 50 project plans in PowerPoint documents created from the same template, it is not easy to determine, say, the average duration of a project or how many projects are over budget.
As the lead architect of robotic process automation (RPA) at SAIC, I helped to analyze data in PowerPoint documents that laid out business growth plans over multiple time horizons. The documents came from a common PowerPoint template and included text descriptions as well as numerical information, such as market size, growth rates, expected revenues and margins, and so forth. The numerical information was conveyed in text, tables, and bar charts.
Enter robotic process automation
The objective was to avoid copying and pasting data across the documents. I wanted to find out whether RPA could be used to effectively automate this process. If so, perhaps RPA could be used to help unlock the knowledge contained in other kinds of PowerPoint documents. The proof-of-concept was to use RPA to extract the data to a Microsoft Excel spreadsheet and use that to perform data analytics.
I created an RPA bot in UiPath, an RPA software platform. I discovered that people in our company were pretty consistent in populating our template-based documents correctly and did not modify the templates or add unexpected charts. So, the RPA bot worked well.
I then sent the database to data scientist colleague Sergio Rego. Looking through the data, Rego immediately ran into challenges with style inconsistencies in the data between the documents. For example, people wrote “$3,000,000,” “$3M,” or “$3,000 (in thousands).” This was not unexpected since PowerPoint doesn’t have data validation, so without guidelines any group of people was likely to be inconsistent with inputs when using a standard form.
The style inconsistencies between documents had to be rectified in the data wrangling process. And as is the case in many data analytics projects, data wrangling was the most time-consuming activity, taking longer than the bot development and execution. Once Rego standardized all the data and used Jupyter Notebook for the analysis, he was able to generate different views of the data, including Monte Carlo analysis to predict ranges of expected financial outcomes for the business projects.
Word challenge
Rego ran into even larger problems with the text data. Given that PowerPoint is a presentation medium, people inputted data in ways that made the most sense to them for presentation. This led to variances in the text data, and Rego would have had to interview the people who made the inputs in order to develop a taxonomy or an ontology that standardized the data. This was not done, since it would have made the proof-of-concept a more expensive and time-consuming activity.
Nevertheless, Rego was able to perform basic word frequency analysis on the narrative inputs and construct world clouds to identify themes. Moreover, he did a linear discriminant analysis (LDA) to segment the data into topics with associated words. This was helpful in identifying general trends and patterns.
The proof-of-concept team got together for a hot wash and determined that RPA could be used to effectively mine knowledge from PowerPoint documents created from the same template so long as the document creators were consistent in how they populated them. Any organization that wants to attempt this activity should expect to do a significant data wrangling effort in order to maximize the value of the extracted data.
Vast amounts of corporate knowledge lie in PowerPoint documents. With robotic process automation and a willingness for data wrangling work, organizations can mine them for decision-making insights.
The team also concluded that data collection would have been made more efficient by using a web or mobile app instead of PowerPoint templates. The app can perform data validation on inputs by users, and RPA or other coding approaches can then populate the PowerPoint documents, ensuring greater consistency and the ability to analyze data across documents while still meeting the goal of presenting complicated information in an easy way.
Front-end work
We suspect that many enterprises are not doing this because the skills required to create PowerPoint templates are simpler than those for writing a web or mobile app. Nevertheless, in cases where a lot of data is being collected over a long period of time, investing in developing an app would yield significant returns in the ability to mine data and see trends, find well- and poorly performing projects, identify risk, and so forth.
Our proof-of-concept demonstrates that RPA can be used to effectively extract corporate knowledge from PowerPoint charts on a wide variety of topics. However, it will almost certainly require a lot of data wrangling work to make data comparable and computable for analysis. Text inputs may require even more standardization work due to different ways people interpret instructions and different ways in which they write.
We recommend that when an enterprise is using PowerPoint to capture a large amount of data from a large number of people, it is better to use a web- or app-based data collection approach to greatly lower the data-analysis cost and increase data usability for decision-making. RPA can then be used to generate PowerPoint documents from data sets for presentation purposes.
MORE DATA ANALYTICS, ONTOLOGY, AND SEMANTIC FRAMEWORK EXPERTISE FROM SAIC:
Ontologies for data fusion and reasoning rise with growth in advanced analytics
Getting to real-time object-data tracking from all battlespace domains
Connected battlespace will need strong modeling for data alignment
Related Content

Perspective
Modern Mission Delivery: Achieving Readiness for Agentic AI
Discover how AI readiness empowers civilian agencies to achieve mission outcomes with trusted data, secure environments, and effective governance.
case_study
Restoring Production of the Navy’s MK48 Torpedo
Learn how SAIC helped the U.S. Navy restart MK48 torpedo production, rebuilding critical manufacturing capabilities and strengthening undersea readiness.

Page
Data Fusion & Interoperability
Advance AI readiness with trusted enterprise solutions that improve decisions, streamline operations and deliver measurable results.